


주메뉴
- About IBS 연구원소개
-
Research Centers
연구단소개
- Research Outcomes
- Mathematics
- Physics
- Center for Underground Physics
- Center for Theoretical Physics of the Universe (Particle Theory and Cosmology Group)
- Center for Theoretical Physics of the Universe (Cosmology, Gravity and Astroparticle Physics Group)
- Dark Matter Axion Group
- Center for Artificial Low Dimensional Electronic Systems
- Center for Theoretical Physics of Complex Systems
- Center for Quantum Nanoscience
- Center for Exotic Nuclear Studies
- Center for Van der Waals Quantum Solids
- Center for Relativistic Laser Science
- Chemistry
- Life Sciences
- Earth Science
- Interdisciplinary
- Center for Neuroscience Imaging Research (Neuro Technology Group)
- Center for Neuroscience Imaging Research (Cognitive and Computational Neuroscience Group)
- Center for Algorithmic and Robotized Synthesis
- Center for Genome Engineering
- Center for Nanomedicine
- Center for Biomolecular and Cellular Structure
- Center for 2D Quantum Heterostructures
- Center for Quantum Conversion Research
- Institutes
- Korea Virus Research Institute
- News Center 뉴스 센터
- Career 인재초빙
- Living in Korea IBS School-UST
- IBS School 윤리경영

주메뉴
- About IBS
-
Research Centers
- Research Outcomes
- Mathematics
- Physics
- Center for Underground Physics
- Center for Theoretical Physics of the Universe (Particle Theory and Cosmology Group)
- Center for Theoretical Physics of the Universe (Cosmology, Gravity and Astroparticle Physics Group)
- Dark Matter Axion Group
- Center for Artificial Low Dimensional Electronic Systems
- Center for Theoretical Physics of Complex Systems
- Center for Quantum Nanoscience
- Center for Exotic Nuclear Studies
- Center for Van der Waals Quantum Solids
- Center for Relativistic Laser Science
- Chemistry
- Life Sciences
- Earth Science
- Interdisciplinary
- Center for Neuroscience Imaging Research (Neuro Technology Group)
- Center for Neuroscience Imaging Research (Cognitive and Computational Neuroscience Group)
- Center for Algorithmic and Robotized Synthesis
- Center for Genome Engineering
- Center for Nanomedicine
- Center for Biomolecular and Cellular Structure
- Center for 2D Quantum Heterostructures
- Center for Quantum Conversion Research
- Institutes
- Korea Virus Research Institute
- News Center
- Career
- Living in Korea
- IBS School


News Center

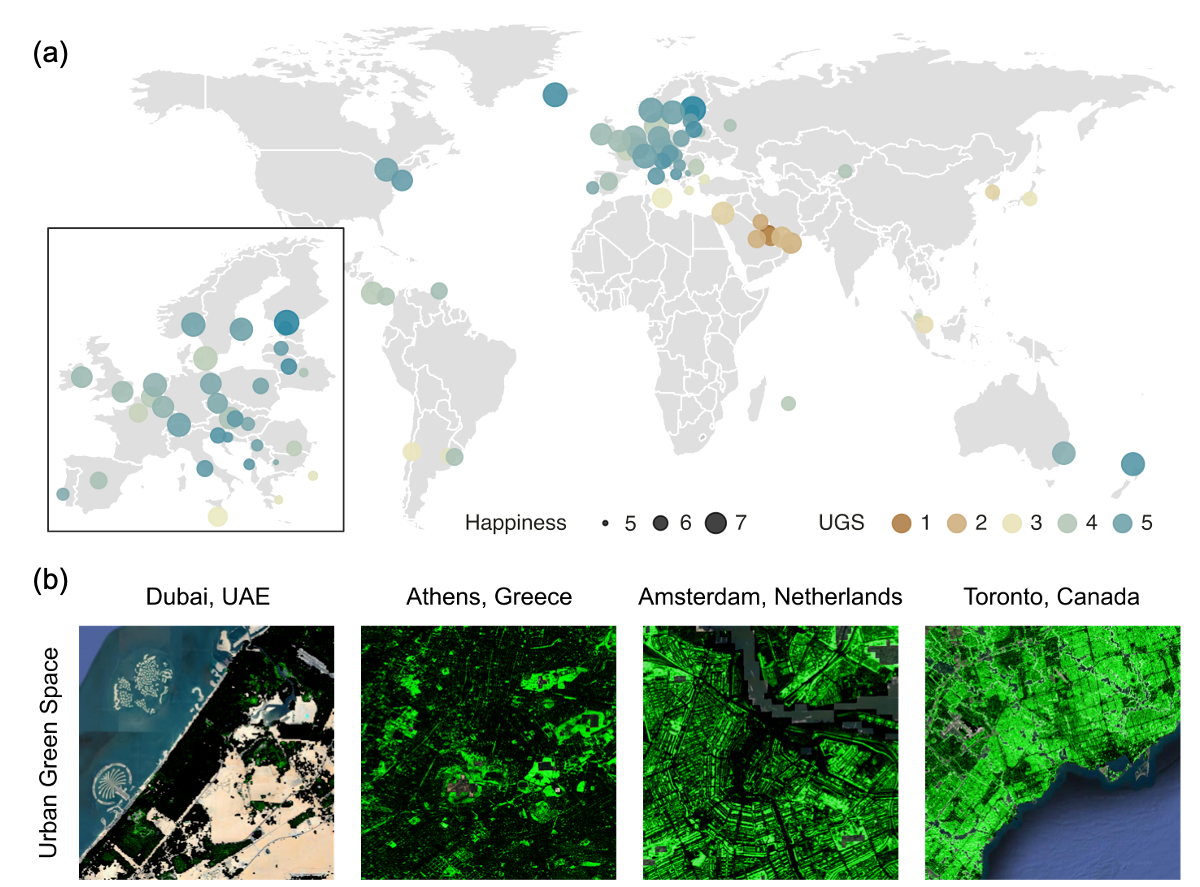
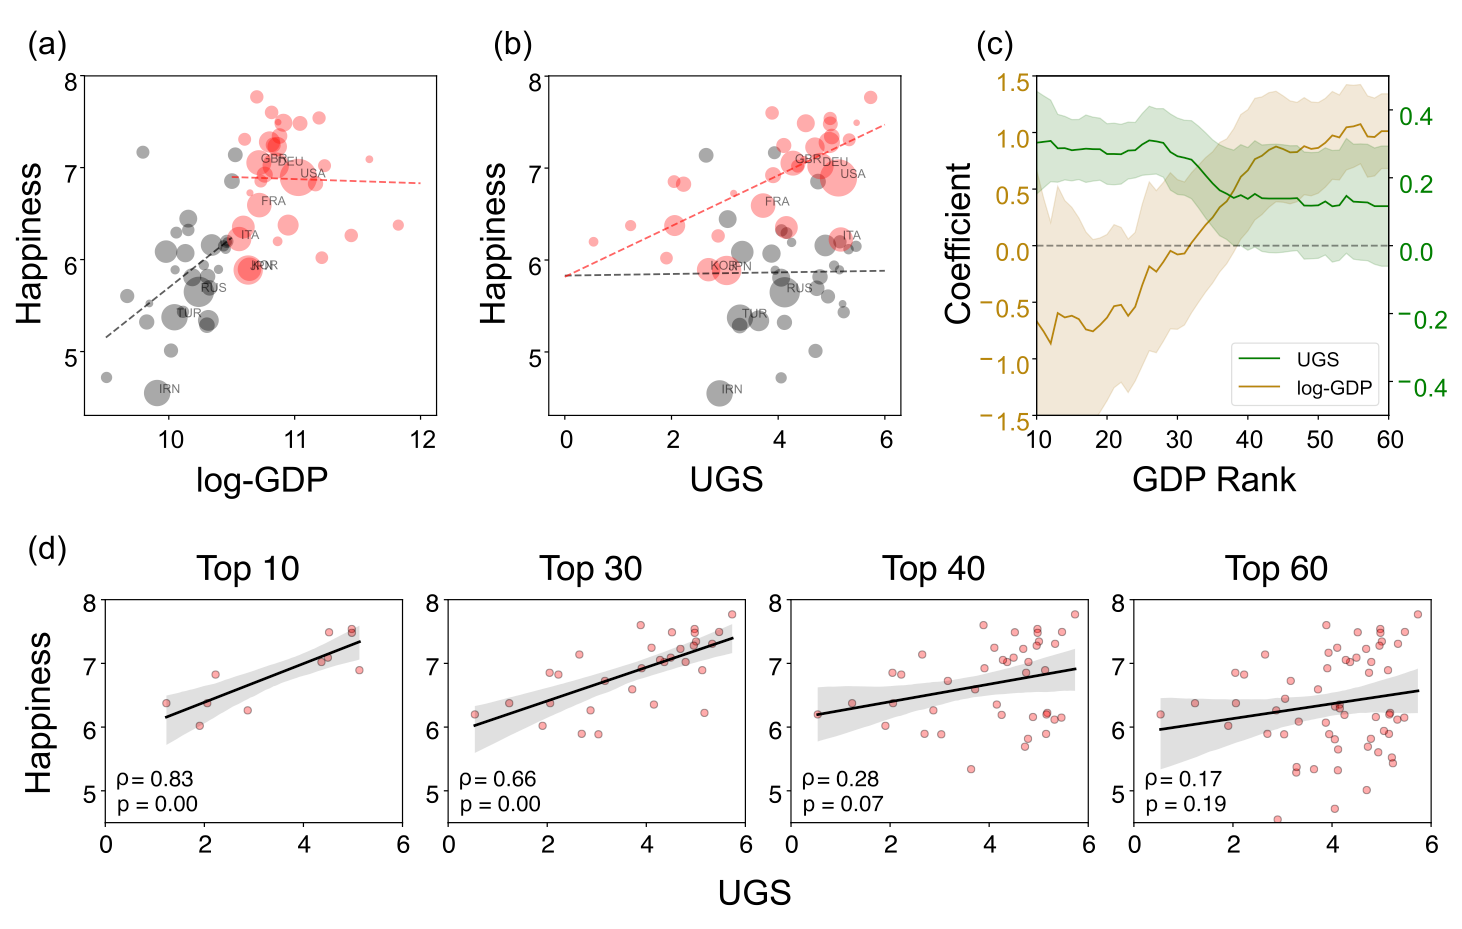
Urban green spaces bring happiness when money can't buy it anymoreHigh-resolution satellite imagery data unveiled a global correlation between urban green spaces and happiness in 60 countries Urban green spaces, such as parks, backyards, riverbanks, and urban farmlands, are thought to contribute to citizenry happiness by promoting physical and mental well-being. While several studies have reported the mental benefits of green spaces, most had been conducted in affluent locations, including the United States and Europe, and only a few involved a multi-country setting. A lack of data had been the main limitation in carrying out studies because there is no global medical dataset that can provide reliable and standardized mental health surveys from different countries. Another challenge involves a systematic method to measure the quantity of green spaces in countries. Various methods of measuring green spaces, including questionnaires, qualitative interviews, satellite images, Google Street View images, and smartphone technology, still rely on individual-level measurements; therefore, they are not scalable to the global level. These challenges left the unanswered question of the association between the positive effects of green spaces on mental well-being for many countries with different socioeconomic conditions. An international collaboration of researchers from POSTECH, the Max Planck Institute, New Jersey Institute of Technology, and the National University of Singapore, led by the Chief Investigator and an Associate Professor CHA Meeyoung, at the Institute for Basic Science (IBS) and Korea Advanced Institute of Science and Technology in South Korea, set out to tackle the issue. Their study, published in EPJ Data Science, identified the global correlation between urban green spaces and happiness in 60 countries using Sentinel-2’s satellite imagery dataset. Using the satellite imagery dataset, the team measured each country’s urban green spaces score as the total vegetation index per population in the most populated cities. A total of 90 cities in 60 countries were chosen to represent at least 10% of the population in the studied countries. For a clear view, only the satellite imagery data from summertime were used for analysis, which is June to September in the Northern Hemisphere and December to February in the Southern Hemisphere. The happiness score was taken from the United Nations’ World Happiness Report. The team found a significant positive correlation between urban green spaces and happiness in all countries. Urban green spaces add increased happiness compared to the baseline happiness value determined by a nation’s wealth. The relationship was robust for other socioeconomic conditions, including life expectancy, health expenditure, unemployment, gender inequality, and education. The team also examined whether this association was uniform across all countries. Happiness in the top 30 wealthiest countries (i.e., GDP per capita of 38,000 USD or above) is strongly affected by the amount of urban green spaces, whereas the GDP per capita is a more critical factor of happiness in the bottom 30 countries. The finding corroborates the conventional wisdom that economic prosperity is crucial for happiness up to a certain level after which, urban green spaces are a better indicator of happiness. The finding coincides with the Easterlin paradox concept, which describes how increases in happiness through wealth reach a saturation point after which the factors that improve happiness are unknown. The team also identified a direct positive relationship between social support for urban green spaces. The relationship indicates that the variable of social support can serve as a mediator between green spaces and happiness. The finding underlines the importance of maintaining urban green spaces as places for social cohesion in support of people’s happiness. The researchers outline several policy-level implications in their work. First, public green spaces should be made accessible to urban dwellers to enhance social support. If public safety in urban parks is not guaranteed, its positive role in social support and happiness may diminish. Also, the meaning of public safety may change; for example, ensuring biological safety will be a priority in keeping urban parks accessible during the COVID-19 pandemic. Second, urban planning for public green spaces is needed for developed and developing countries. As it is challenging or nearly impossible to secure land for green spaces after the area is developed, urban planning for parks and green spaces should be considered in developing economies where new cities and suburban areas are rapidly expanding. Third, recent climate changes can present substantial difficulty in sustaining urban green spaces. Extreme events, such as wildfires, floods, droughts, and cold-weather waves, could endanger urban forests, while global warming could conversely accelerate tree growth in cities owing to the urban heat island effect. Thus, more attention must be paid to predict climate changes and discovering their impact on the maintenance of urban green space. The team also noted the increasing demand for data-driven policymaking for citizens. “Big data from satellite imagery can provide great opportunities to answer a variety of social issues. Our method can be used to quantify blue space at shores, and we may further study the relationship between blue spaces and happiness,” says Dr. Cha.
Notes for editors - References - Media Contact - About the Institute for Basic Science (IBS) |
|||
|
|

| Next | |
|---|---|
| before |
- Content Manager
- Public Relations Team : Yim Ji Yeob 042-878-8173
- Last Update 2023-11-28 14:20
55, Expo-ro, Yuseong-gu, Daejeon, Korea, 34126
Tel. +82-42-878-8114 | Fax. +82-42-878-8079 | E-mail. webmaster@ibs.re.kr
Copyright(c) IBS. All Rights Reserved.
